|
|
Sysoft ® |
|
|
Dynamic network data visualization with Visio
Solution You can define the network and its connections in Amarco. If you have a complex network with a lot of interfaces and components, a diagram with all elements is simply not understandable. We advise to split the global network into regions and sub-regions (a layered network). You can store in a specialized database your hierarchical organization and draw it automatically. You can also associate traffic information (or other numerical values) to various connections, that Amarco can display automatically in various ways, illustrating the capacity used or remaining.
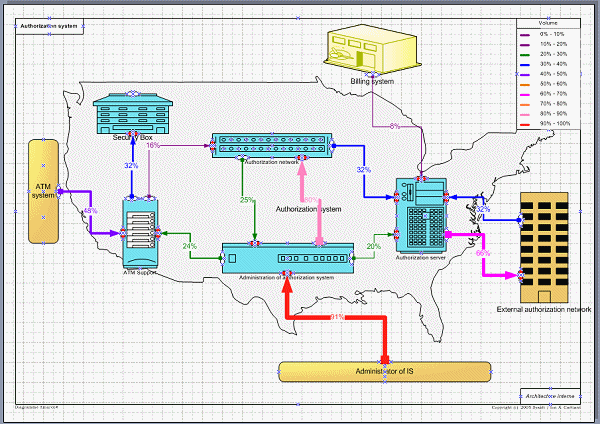
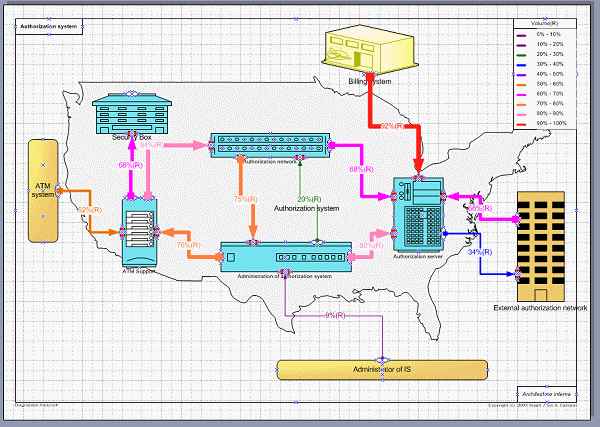
Based on imported data, the traffic is displayed as percentage of the total communication line capacity. In this example, the size of the connection lines depends on the value of the associated numerical value - line load. You see at a glance the line load. Each item may represent a whole region, where you can drill down for more finer information. An example of this kind of layered network documentation and navigation is displayed here. Alternate view - the most available communication lines You can also see the most available (less loaded) lines, a symmetrical view of the previous one.
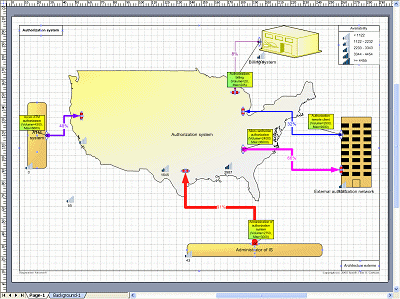
Global view - Input / output in the system.
|
|||
|


