|
|
Sysoft ® |
|
|
Advanced data visualization in Visio diagrams
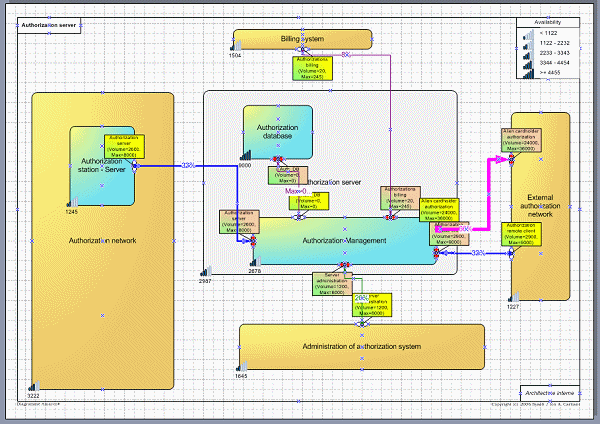
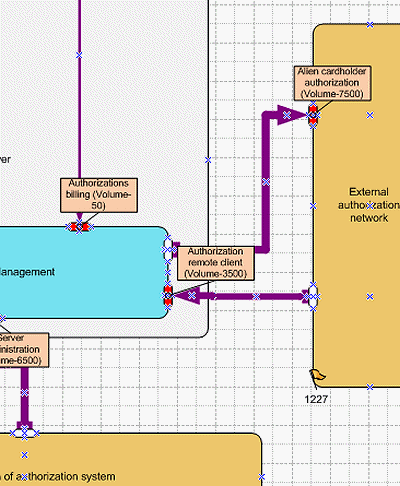
Solution Amarco can associate automatically your diagram (the Visio shapes) with values stored in the database. These values may refer to the "systems" or to the "interfaces" (data flows). Amarco provides the possibility to import these data from an outside file (Excel or XML), so you can produce updated diagrams with the latest available figures. For systems, Amarco associates icons to the value interval. For interfaces, Amarco can vary the size of the connection line according to the related value. . You can assess visually the status of your systems. The legend is generated automatically with the chosen icon family and your interval data. Graphs icons show the relative importance of the data. The size of the connection lines depends on the value of the associated numerical value (volume, throughput...). With a click you select the icons that suit best your preferences to display the associated numerical values. Amarco will select the appropriated image in its family, according to the data value.
You can see another example of this feature applied to network traffic supervision on this page. |
|
|

